

Research
How much of a QR code can a logo cover? We measured the real ceiling
By OpenQR · updated 18 November 2026
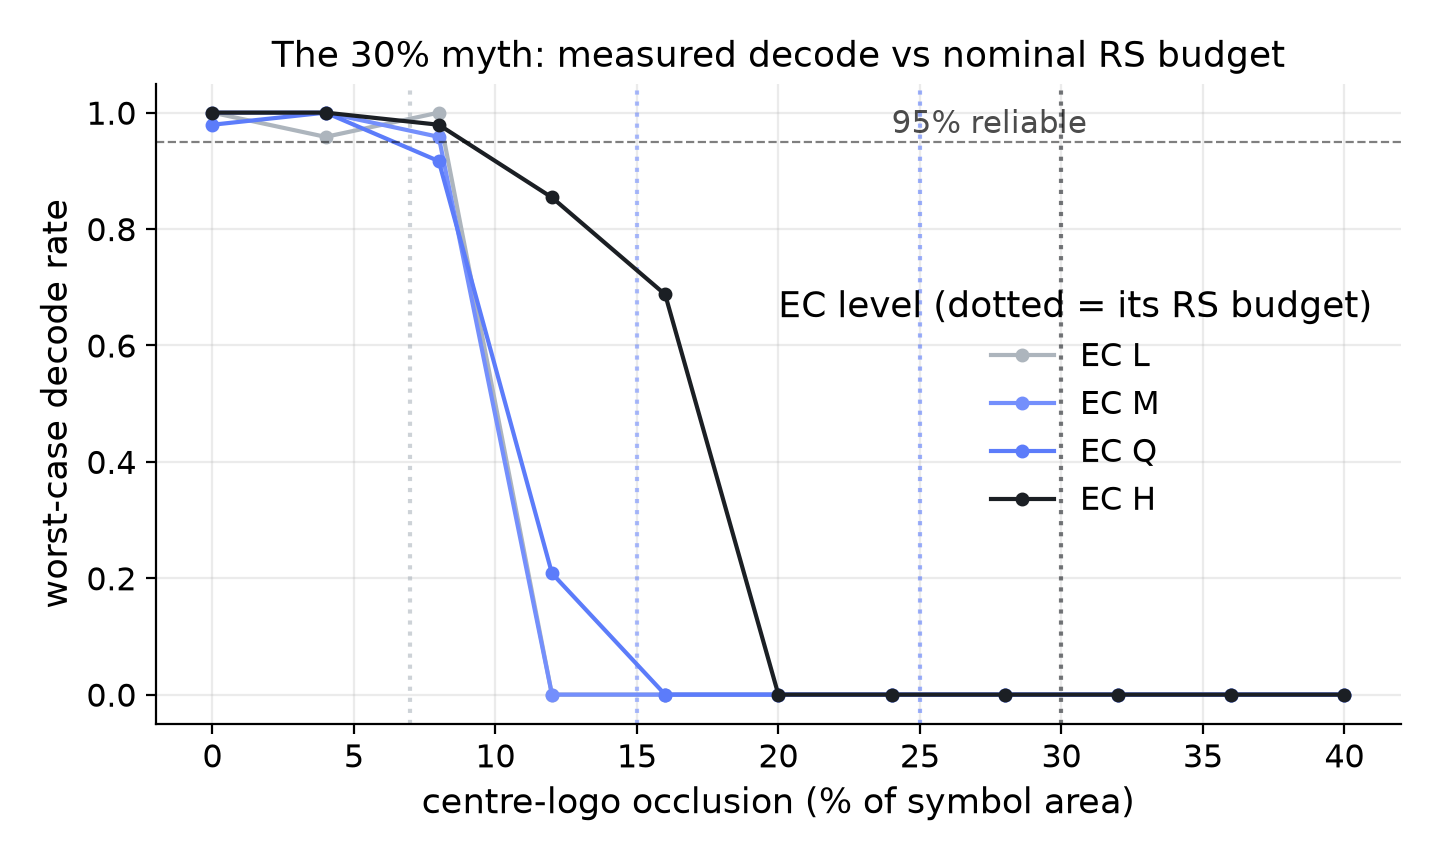
Every QR generator repeats the same promise: pick error-correction level H, and your logo can cover about 30% of the code. We build a generator, our users print logos on codes that end up on tables and posters, and at some point we wanted to know whether the number we were passing on had ever been measured. So we measured it: 58,048 decode attempts across four pinned open-source decoders, a synthetic camera pipeline, three payloads, and - because the decode rates alone do not tell you why - a codeword-level audit that walks the exact symbols' module matrices through the ISO placement and counts corrupted Reed-Solomon codewords per block. The short answer: the 30% rule is an arithmetic error that happens to be repeatable. The real ceilings are about 9% of area for the weakest readers and about 16% for everything else.
9 min read · Updated 18 November 2026
The answer
For a centred logo, the 95%-success ceilings, stated as brackets over the measured grid (interpolated values in brackets):
| Level | Worst-case decoder | Excluding OpenCV's detector |
|---|---|---|
| Effective M (version 2) | 8-12% (8.2) | 8-12% (8.2) |
| Q (version 3) | 4-8% (6.4) | 8-12% (9.1) |
| H (version 4) | 8-12% (8.9) | 16-20% (16.2) |
Two footnotes to that table. First, at these versions requested L and M are the same symbol (our encoder, like most, silently boosts L to M when there is room), so the EC axis has three distinct configurations, not four. Second, the worst case at Q and H is set by one implementation, OpenCV's QRCodeDetector; the other three libraries all read to the same ceiling.
The two-sided rule: budget about 9% of the symbol's area if OpenCV-class readers must succeed, about 16% if they need not. Both are a long way from 30%.
What we measured
Four decoders see every capture: ZBar (via pyzbar), OpenCV's QRCodeDetector, OpenCV's WeChat pipeline (a CNN detector with super-resolution), and zxing-cpp. Four pinned versions, the same renders, exact-payload matching.
Each symbol goes through a synthetic capture pipeline (resampling to a target pixels-per-module, blur, sensor noise, JPEG, small rotation and perspective), so a code is judged as a camera would see it, not as a clean render. Centre-square logos from 0 to 40% of the symbol's area, in both an excavated style (white pad, the "designed" look) and an opaque overlay (the naive paint-over).
The rule, and what it conflates
The folklore says level H "tolerates 30% damage, so you can cover 30% of the code with a logo." Current generator guidance states it outright: "keep logos within 30% of total QR code area," and "you can cover nearly a third of the code and still get a perfect read."
The 30% figure itself is real, but it counts something else entirely. Denso Wave's own explanation defines the 7/15/25/30% error-correction figures as restoration rates over codewords, the 8-bit units that make up the symbol's data region. A codeword is not an area. A single flipped module spoils a whole codeword, codewords straddle a logo's edge, and the correction capacity binds per interleaved block, not in total. Three different quantities get flattened into one percentage: codewords, area, and end-to-end decode probability on a real camera.
Why the ceiling sits there: the codeword audit
Decode rates tell you where the ceiling is, not what it is made of. The audit closes that gap.
It takes each exact benchmark symbol, walks the ISO/IEC 18004 module placement and block interleaving (validated by round-tripping the undamaged symbol's data codewords back to the exact payload), paints the logo onto the matrix, and counts how many codewords each block has lost - one flipped module is enough to spoil an 8-module codeword. A block fails Reed-Solomon decoding when its corrupted count passes its capacity t.
For the version-4 level-H symbol (four blocks of 9 data + 16 parity codewords each, capacity t=8 per block, budget 32 of 100 codewords):
| Centre logo | Modules changed | Codewords corrupted | Per block (t=8) | Verdict |
|---|---|---|---|---|
| 8-9% of area | 3.8% | 13 of 100 | [4, 5, 1, 3] | fine |
| 16% of area | 7.7% | 28 of 100 | [7, 7, 7, 7] | 87.5% of budget; decodable |
| 18% of area | 10.6% | 34 of 100 | [8, 8, 10, 8] | one block overflows |
All four decoders read the pristine render at 16% and fail at 18%. The pristine ceiling is the Reed-Solomon budget, and interleaving spreads a centre logo's damage almost perfectly evenly: [7, 7, 7, 7] against a capacity of 8.
So the folklore's arithmetic finally has a shape: a 16%-area logo consumes 28 of the 32-codeword budget. The nominal 30% is delivered, roughly, as promised - but codeword granularity, the function-pattern share of the symbol, and edge straddling map "30% of codewords" onto only 16-20% of area at these versions. Area understates codeword damage by two to three and a half times, which is the opposite of the intuition that a gentle white pad is conservative.
Between 9% and 16% sits the capture penalty: across that band the codes decode perfectly with no camera degradation and fail only under the blur-and-noise pipeline, so failure there is front-end limited, not data loss. Your logo spends both budgets at once.
Excavate, do not paint over
The logo's implementation matters as much as its size. An opaque black block painted over the symbol decoded materially worse than an excavated white pad at the same nominal area (matched conditions, every decoder losing 5-12 points), and the audit explains why: an overlay flips the light modules, and on small versions that corrupts a codeword set with less per-block slack.
Excavate the pad; never overlay. The audit puts the overlay ceiling at 4% of area versus 10% for a white pad at effective M. A painted-on logo spends your error correction twice as fast.
What this means if you are designing one
- Treat 30% as a codeword statistic you will never see in area terms. At the versions most URLs print at, your working budget is roughly a tenth of the code for worst-case readers, a sixth otherwise.
- Prefer the smaller number when the code matters. Posters, packaging, anything scanned in a hurry: design to 9% and the weakest reader in the population, because you cannot choose your customers' scanners.
- Excavate the pad; never overlay.
- Verify the finished code by decoding it, not by trusting the level. The Scannability Margin score from the study ships in our generator and grades a design before you print it.
Limits of these measurements
Honesty box, same as the paper. These are four pinned software decoders, not a sample of the world's phones (phone stacks mostly behave like the strong tier; Apple's and Google's own decoders are named targets of the follow-up). The capture pipeline is synthetic - its blur, noise and JPEG levels set where the cliffs sit, and the numbers are conditional on that.
Three payloads, one automatically chosen mask each, versions 2 to 4: the follow-up study sweeps payloads, masks, and larger versions, where a centre logo starts hitting alignment patterns. And the codeword audit is exact for these symbols, not a simulator's guess; both the audit and every number above regenerate from the committed dataset.
The full paper is readable at the scannability benchmark page, with the PDF, dataset and DOI (10.5281/zenodo.24352636).